See Your Business Clearly
We build the dashboards, data pipelines, and analytics systems that turn raw data into operational intelligence. Powered by a decade of Tableau, D3.js, and data engineering expertise.
Dashboard Design & Development
Interactive dashboards that people actually use. We design for clarity, build for performance, and optimize for adoption.
Data Engineering
Clean, reliable data pipelines that feed your analytics. From source integration to transformation to delivery.
Tableau & D3.js Expertise
A decade of Tableau experience plus custom D3.js visualizations: architecture, server administration, interactive dashboards, and governance.
Analytics Architecture
End-to-end analytics strategy. We design the data stack, define metrics frameworks, and build the infrastructure to support them.
Metrics & KPI Frameworks
Define what matters, measure it consistently, and make it visible. We build metrics systems that drive accountability.
Custom & Embedded Analytics
Custom D3.js visualizations and analytics integrated directly into your applications and workflows, so insights arrive where decisions happen.
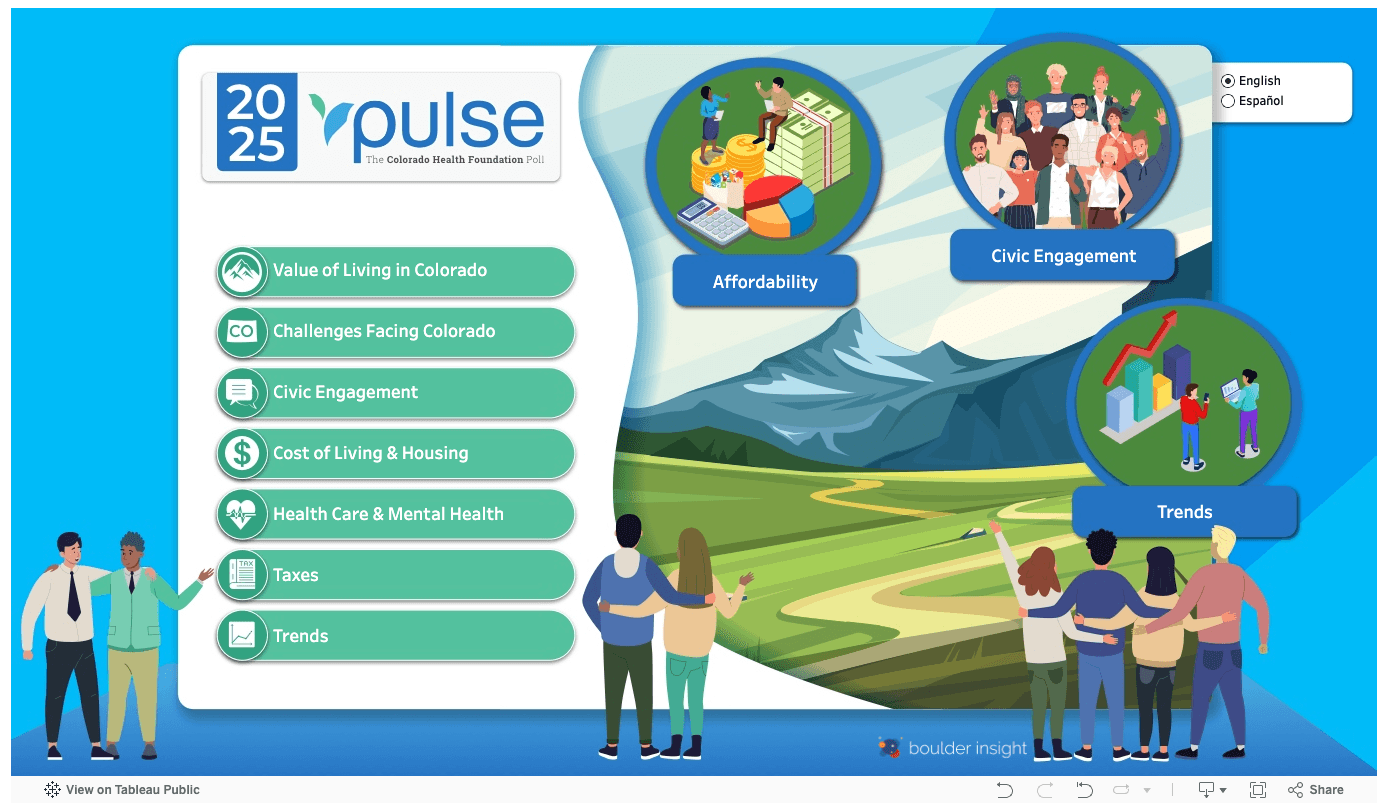
Colorado Health Foundation - Pulse Poll
Bilingual interactive Tableau dashboard presenting statewide health survey data across 7 topic areas. Built for public consumption with illustrated navigation and demographic drill-downs.
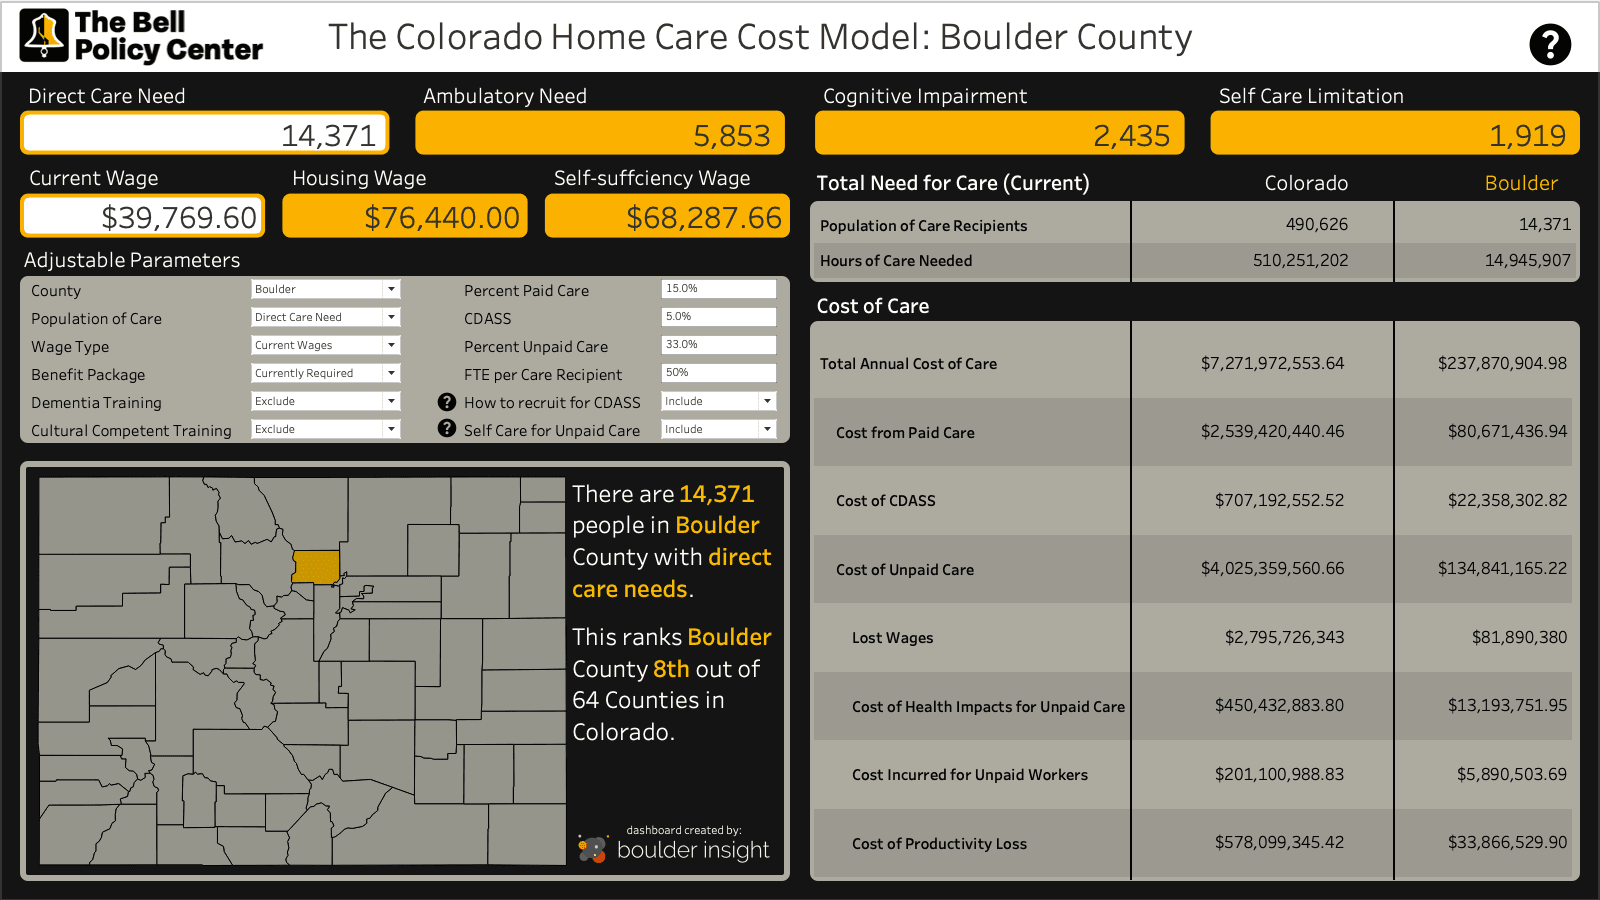
Bell Policy Center - Home Care Cost Model
Interactive cost modeling tool enabling policymakers to analyze home care costs across all 64 Colorado counties with adjustable parameters for wages, care types, and demographics.
Common Questions
Stop guessing.
Start building systems that work.
Whether you need AI automation, better dashboards, or team training, book a strategy session and we'll map your highest-impact opportunities in 30 minutes.